Here are some charts that help to explain Revelation’s story. Choose the display option that works for you.
- NEW CHARTS! Charts outlining events from Creation to the New Earth
- The Chart Book – Detailed Information about the 17 Apocalyptic Prophecies
- Jubilee Calendar and 7,000 Years Desktop | Mobile (Large File)
- Jubilee Calendar Desktop | Mobile
- Daniel 7, Daniel 8, and the Seven Seals Desktop | Mobile
- A Chart of Coming Events Desktop | Mobile Pg 1 | Mobile Pg 2
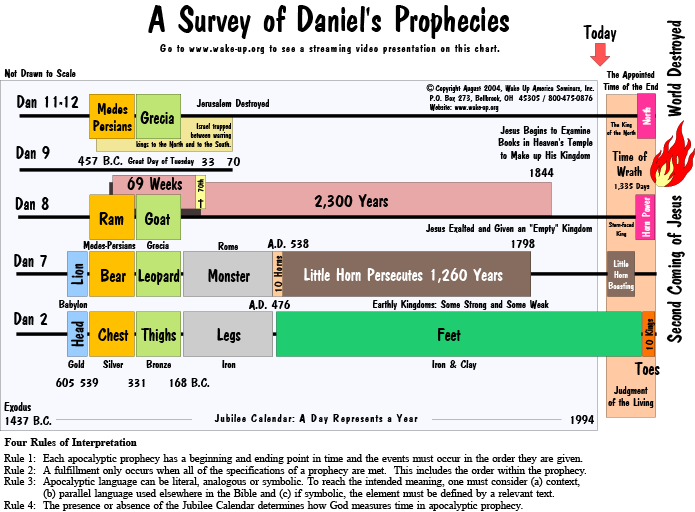
- 17 End Time Prophecies Desktop | Mobile
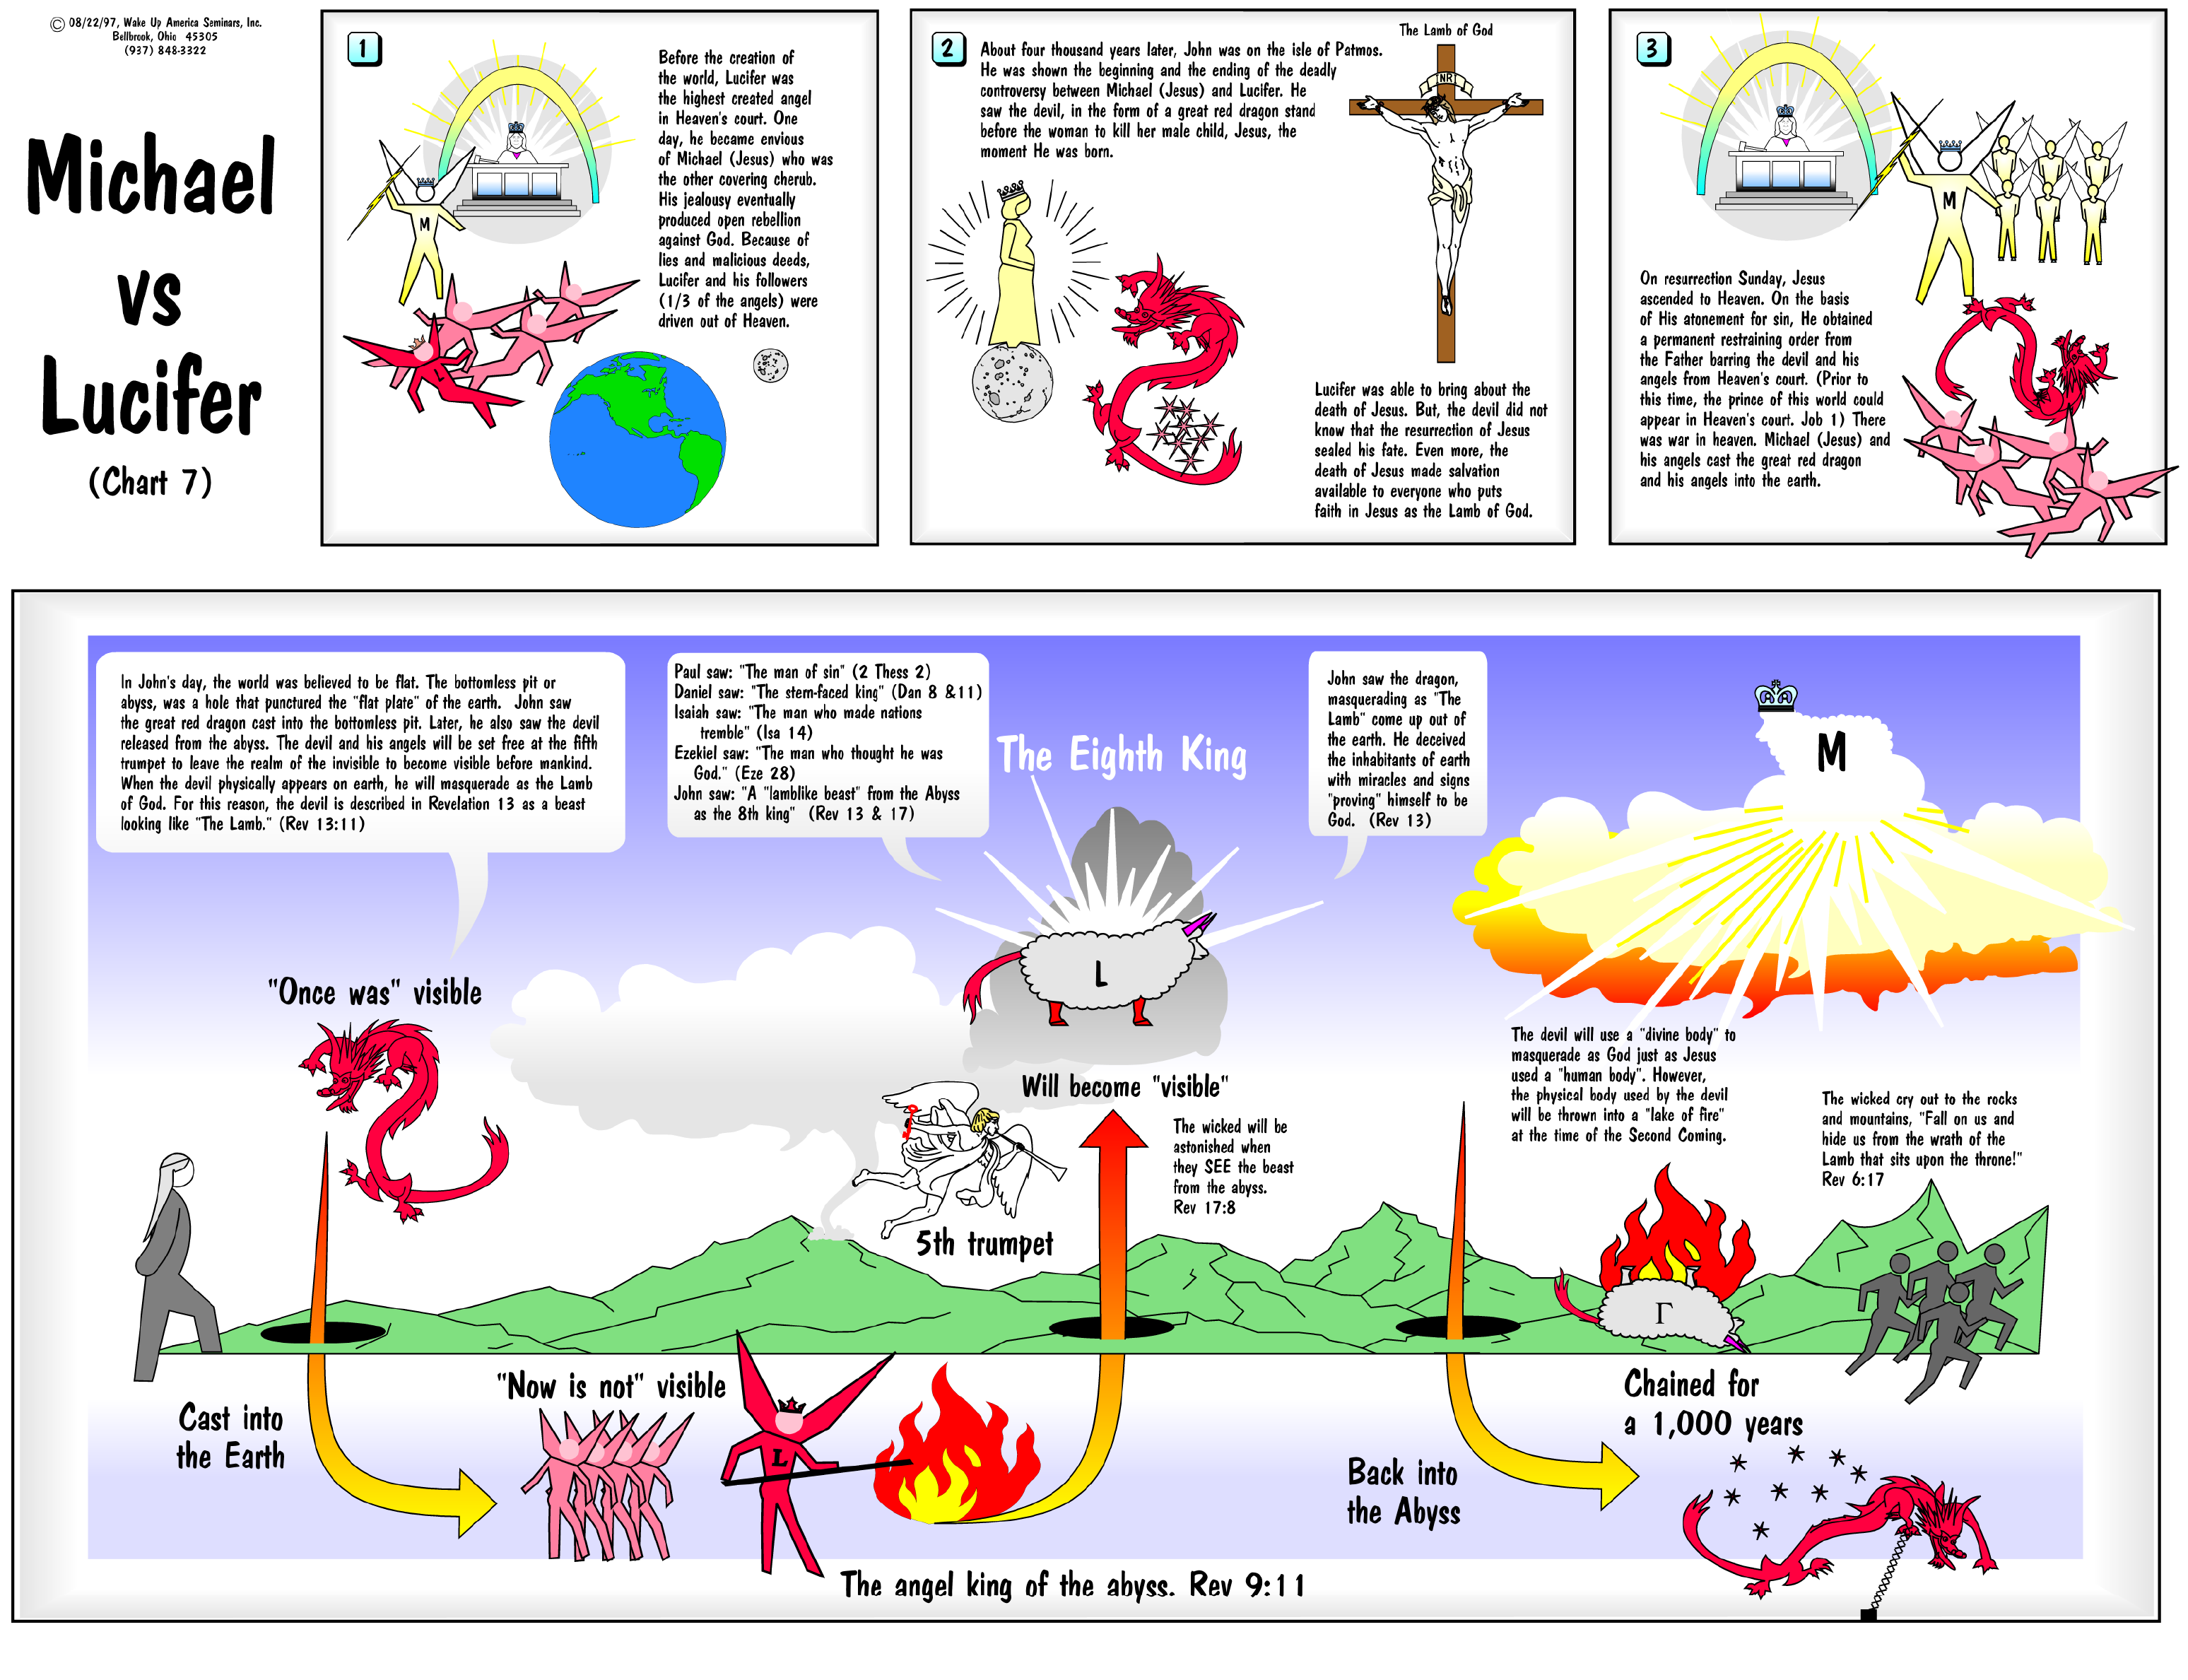
- The Battle Between Michael and Lucifer Desktop | Mobile
- Reasons for Sin Existing 7,000 Years Desktop | Mobile
- God’s End Time Wrath Desktop | Mobile
- Linkages between Daniel and Revelation Desktop | Mobile
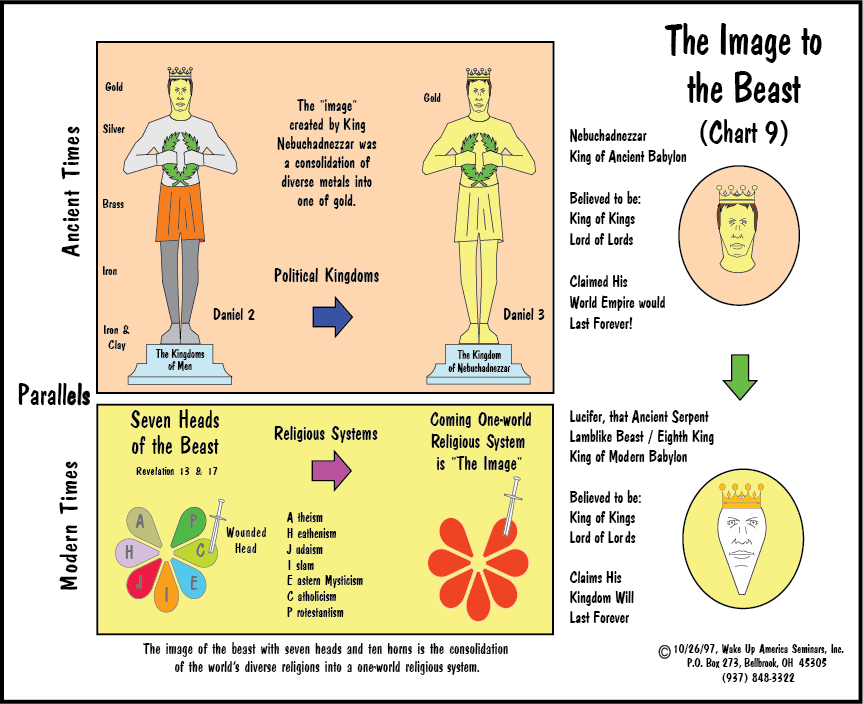
- Nebuchadnezzar’s Image Desktop | Mobile
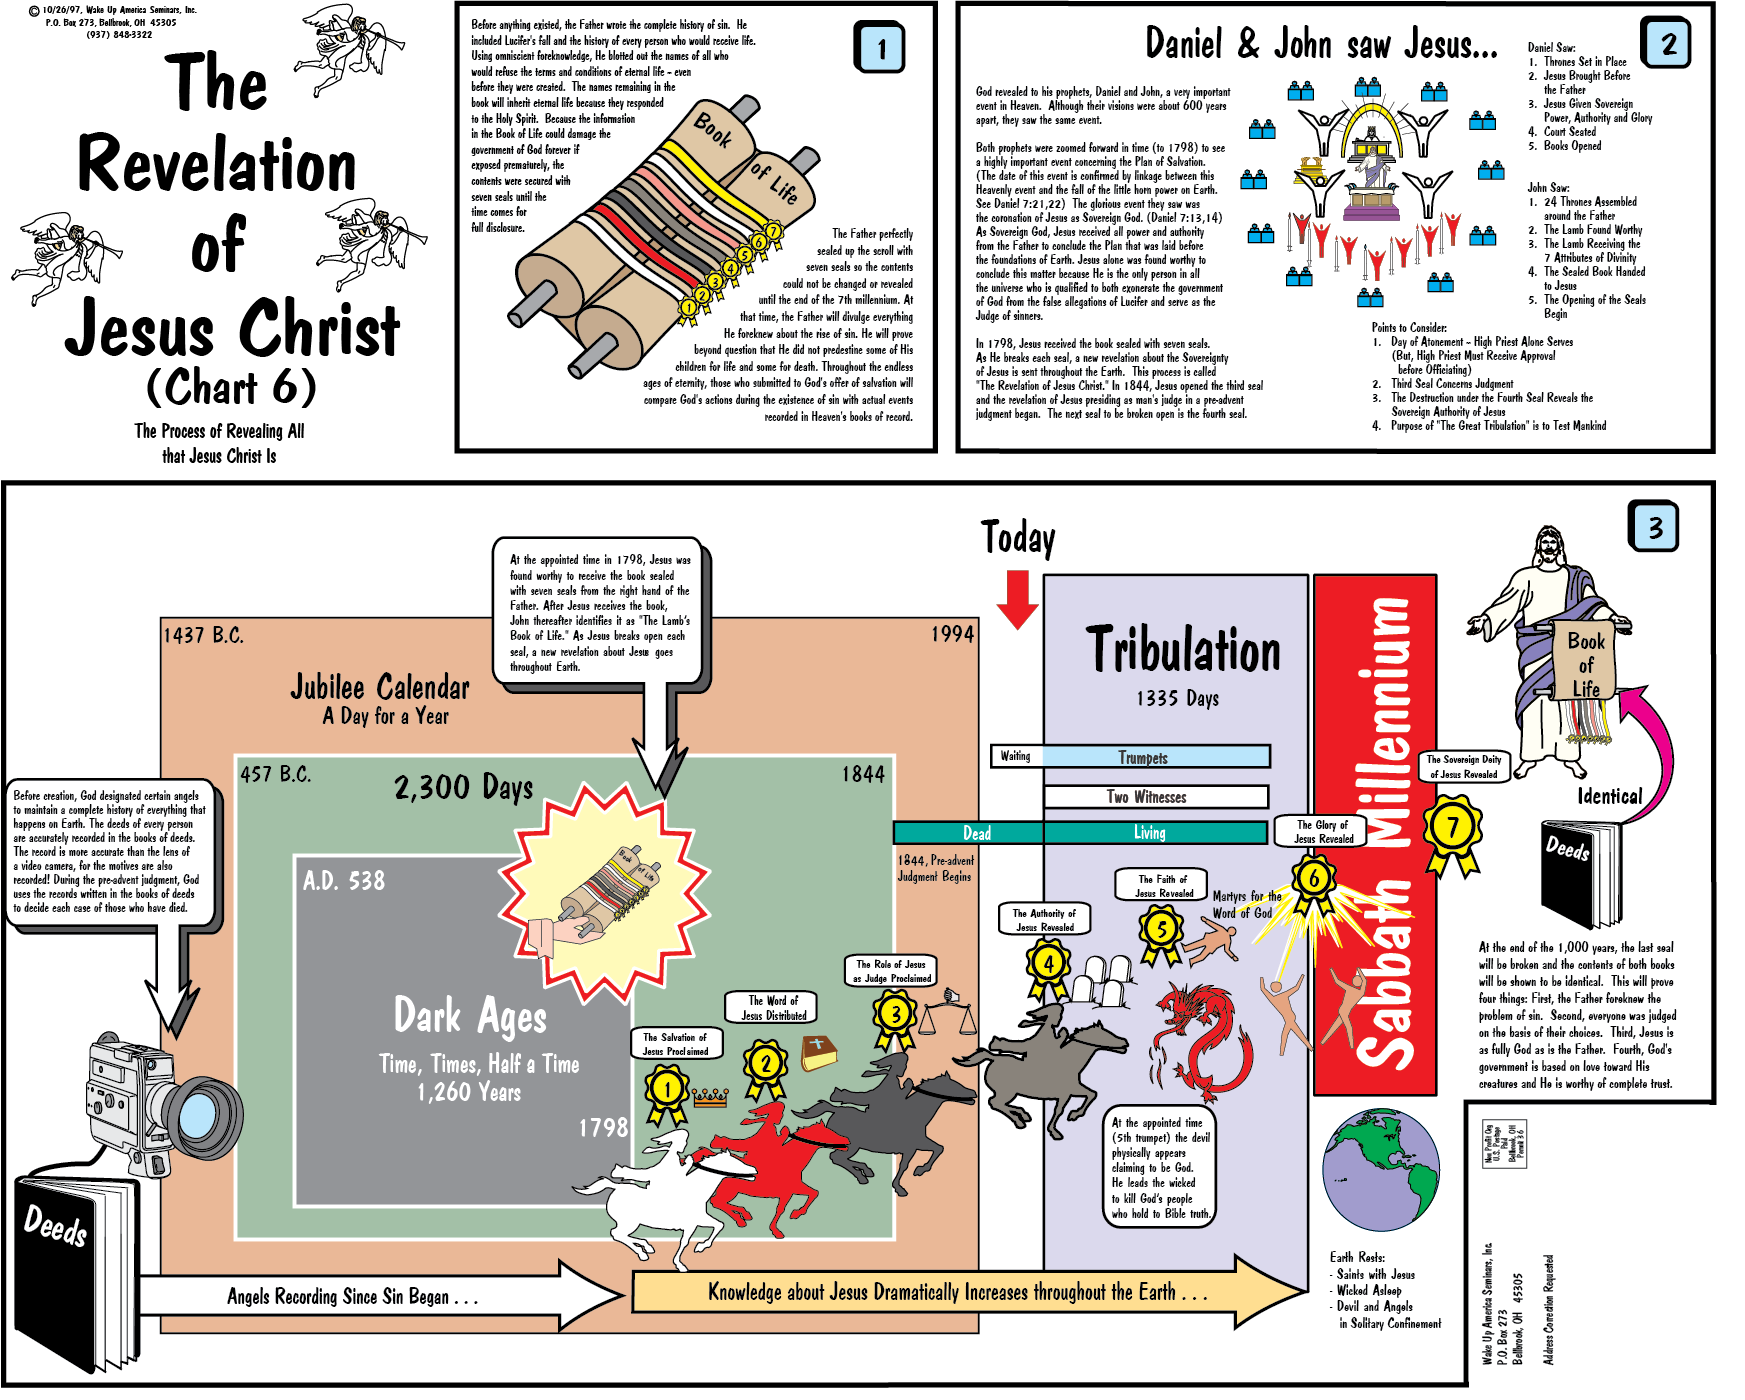
- The Seven Seals Desktop | Mobile
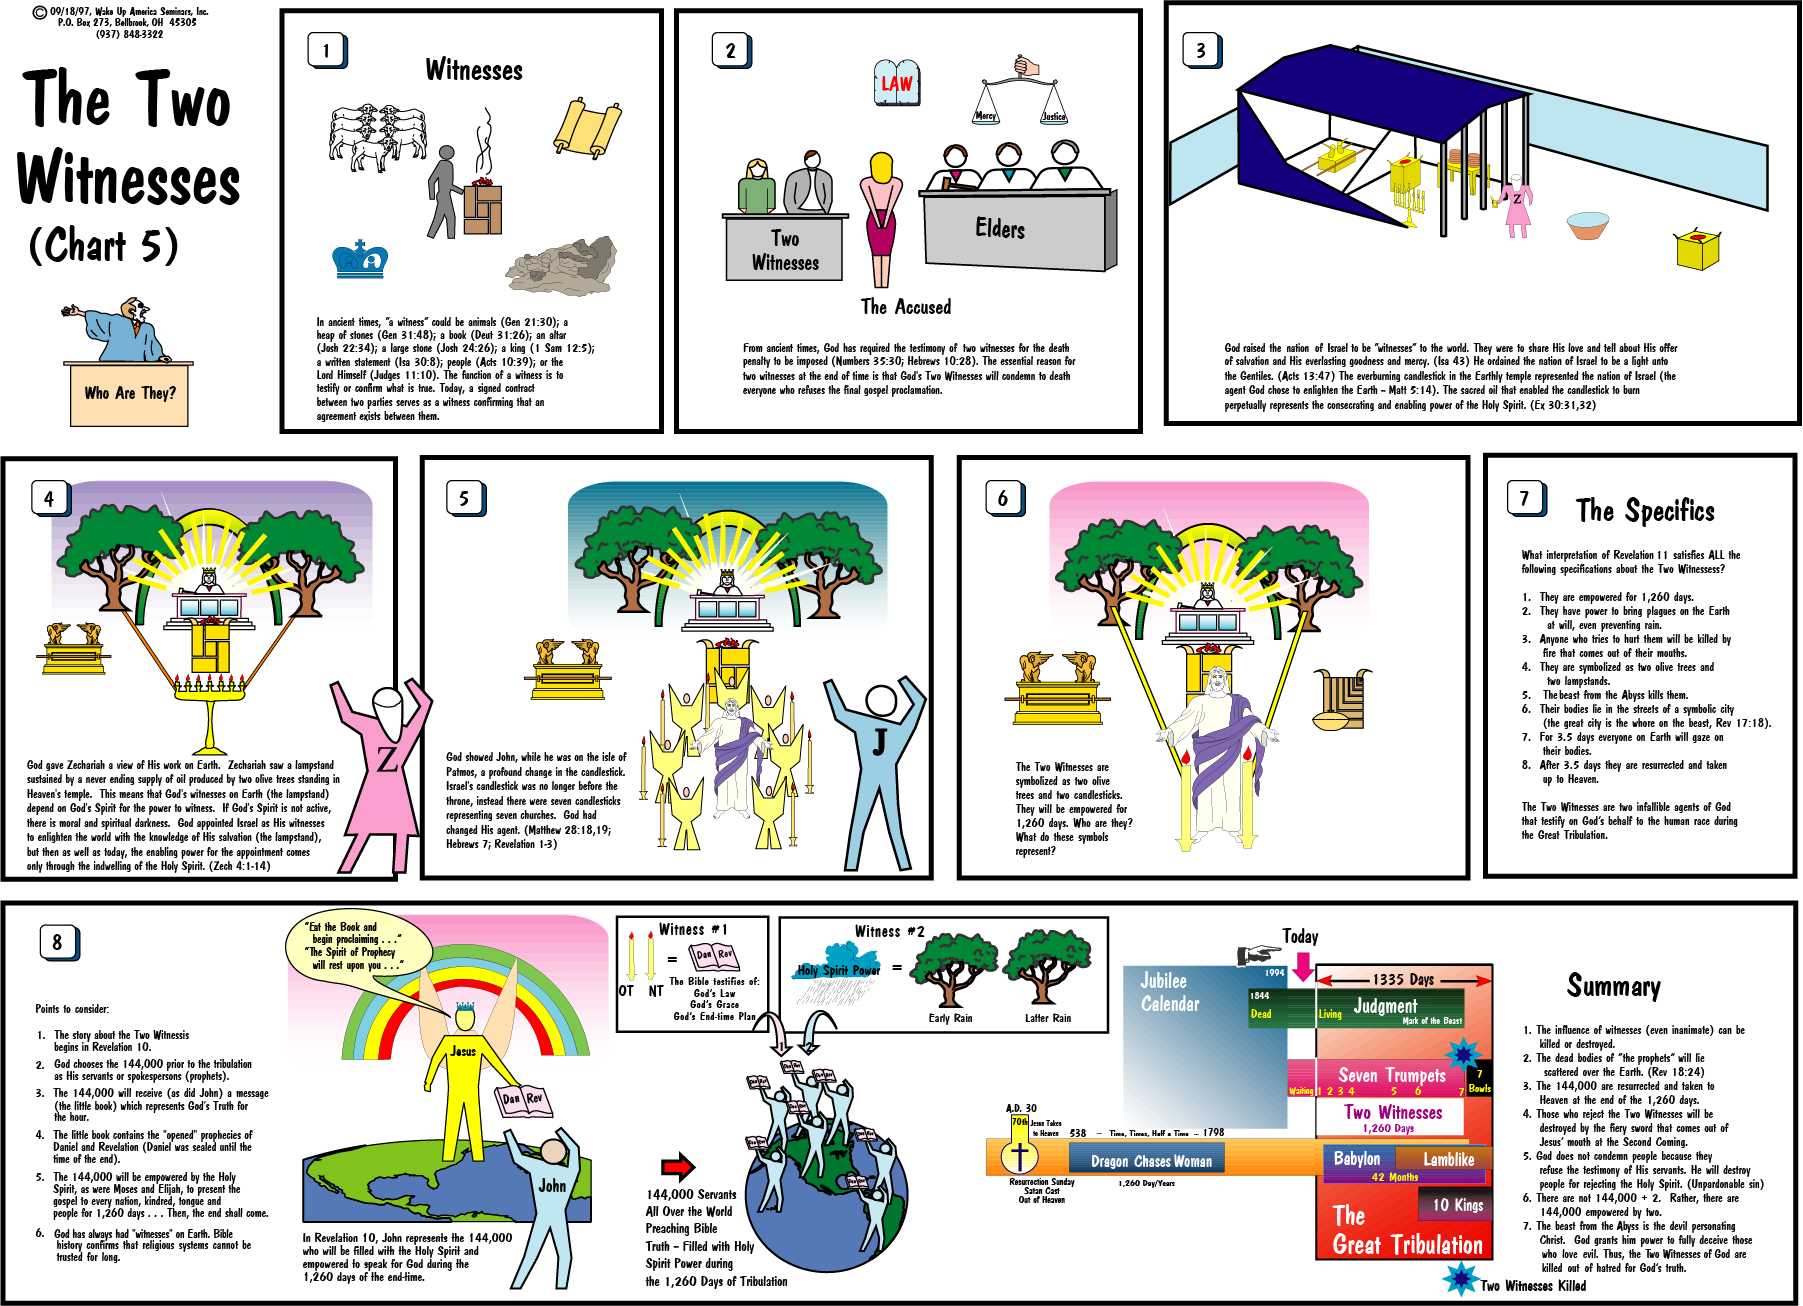
- The Two Witnesses Desktop | Mobile
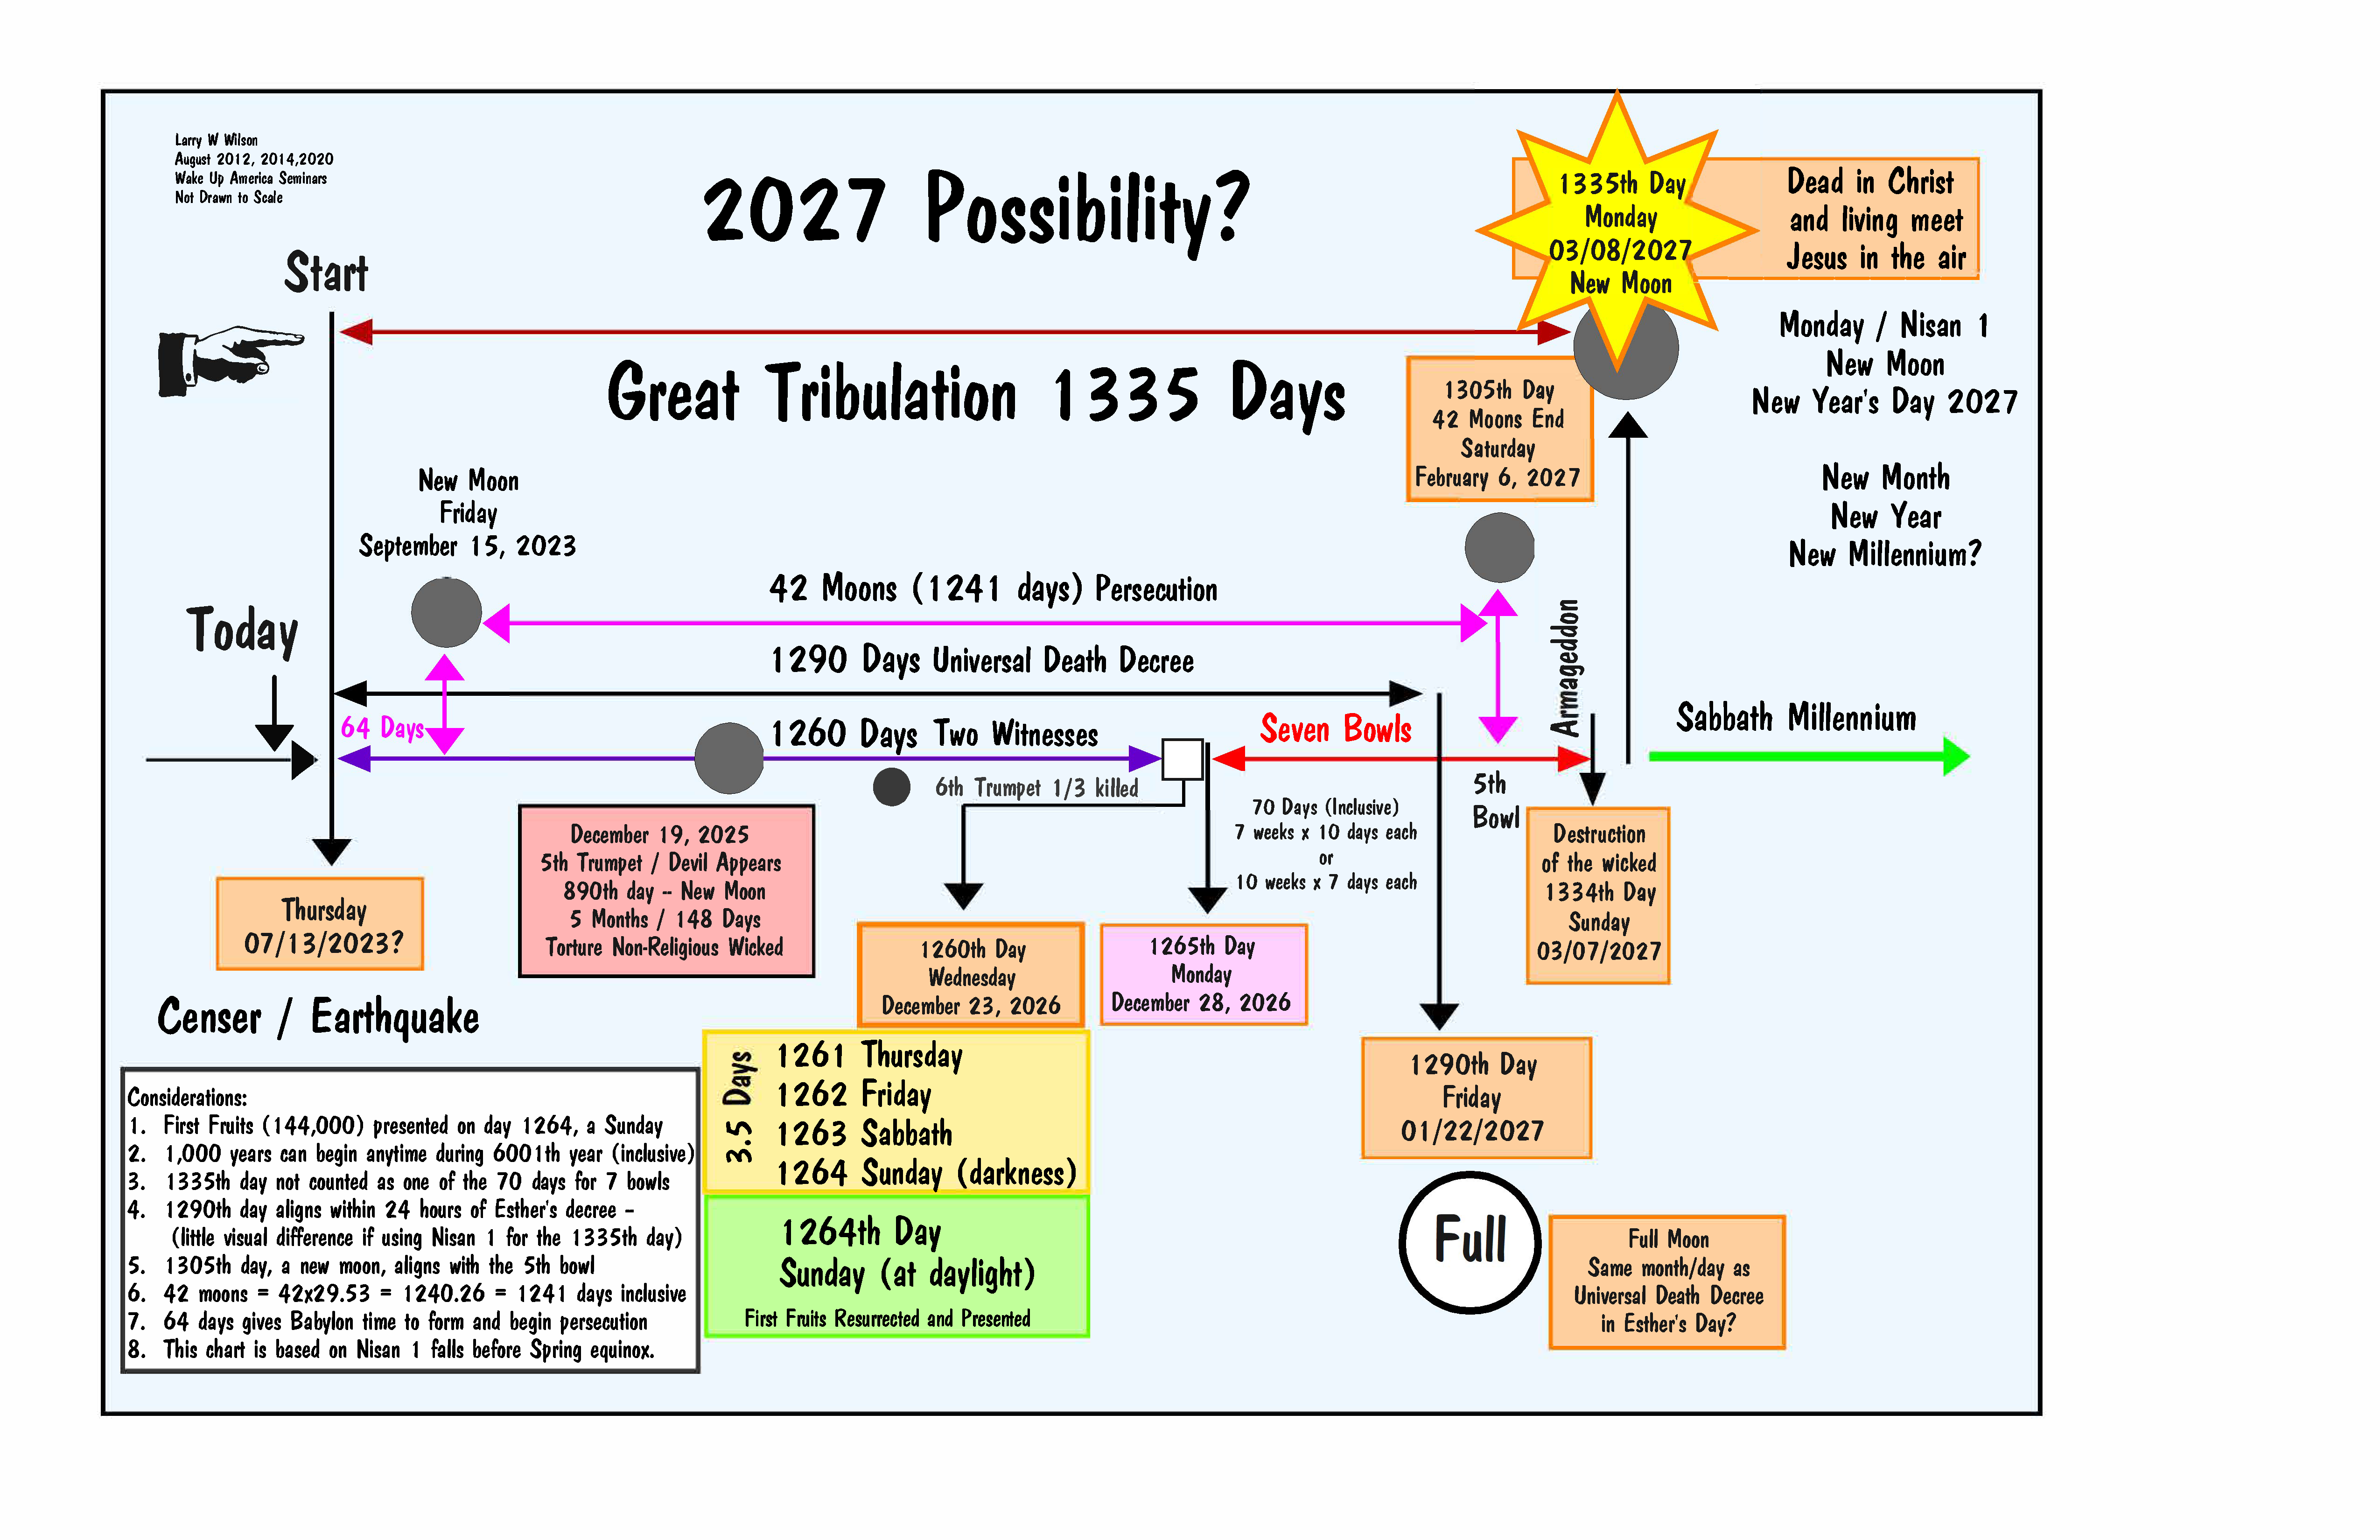
- The 1,335 Days Desktop | Mobile
– Scenario of the final 1,335 days (Sample dates to show timing between events only) - Charts Accompanying September 2006 Video
Chart 1 | Chart 2 | Chart 3 - Charts Accompanying February 2010 Video
Chart 1 | Chart 2 | Chart 3 | Chart 4

